Cultivate Curiosity, Inspire Imagination.
-
Products
- Arduino
- Bare Conductive
- Battery
- Cable and Wires
- Circuit and DIY Electronics
- Components
- Enclosure
- ESP8266 and ESP32
- LILYGO
- LED
- M5Stack
- micro:bit
-
Modules
- Artificial Intelligence (AI) Modules
- Breakout Boards Modules
- Button, Joystick and Keypad Modules
- Buzzer, Speaker, MP3 and Amplifier Modules
- Charging Modules
- DC Buck Converters
- Display Modules
- Ethernet, Wireless and Accessories Modules
- Fan and Vibration Modules
- GPS Modules
- LED and Laser Modules
- MOSFET, Voltage, Current and VR Modules
- NFC, RFID and Accessories Modules
- Relays and Accessories Modules
- Motor
- Power
- Raspberry Pi
-
Sensors
- Accelerometer, Gyroscope and Magnetometer Sensors
- Current, Hall and Voltage Sensors
- Distance, Obstacle and Accessories Sensors
- Fingerprint, Pulse and Heart-Rate Sensors
- Light, Line, IR and Colour Sensors
- PIR, Proximity and Motion Sensors
- Speed & Encoder Sensors
- Temperature, Air, Wind, Gas and Soil Sensors
- Touch, Sound and Vibration Sensors
- Water and Flow Sensors
- Weight, Pressure, Force and Flex Sensors
- STEM Education Kits
- Teensy
- Tool
- Projects
- Portfolio
- Tutorials
- Courses
NODE RED IOT WITH GRAFANA CLOUD DASHBOARD
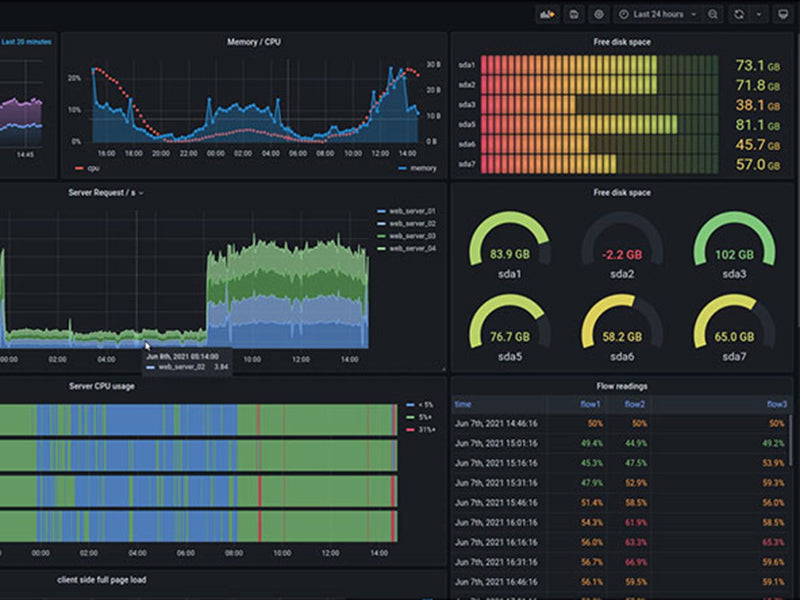
Edge Devices with Node-RED and Grafana Cloud Dashboard
Are you looking for an easy and efficient way to wire together flows using a variety of nodes? Look no further than Node-RED's browser-based flow editor, which can help you deploy flows to the runtime with a single click. With a built-in library and rich text editor, you can create useful functions, templates or flows for re-use.
Visualize and analyze your data stored anywhere with Grafana, which helps you create flexible and beautiful dashboards. You can easily query, alert, and understand your data to gain valuable insights.
If you're interested in physical computing and its applications, this workshop is for you. From electronics and coding to mechanical engineering and robotics, physical computing is an essential skill for many jobs in the future. Our hands-on learning experience will teach you the fundamentals of physical computing and provide you with a custom-built project to continue tinkering on at home. Don't miss out on this opportunity to expand your skills and knowledge.
Course Outline
Raspberry Pi & IoT using Node-RED
- Getting started with Node-RED
- Running Node-RED locally on your Raspberry Pi
- Node-RED Nodes (Core Nodes, JSON and Dashboard..)
- Raspberry Pi interfacing with Hardware using Node-RED
- Raspberry Pi Interfacing with Sensors – DHT11/DHT22
- IOT with Node-RED
- MQTT using Node-RED
Grafana Cloud Dashboard
- Install and Setup on Raspberry Pi
- Setup a Prometheus DataSource
- Building DashBoards
- Visualizing DashBoards
- Variables
- Alerts – Create a Notification Channel
- Syncing up with a JSON Data Source

Sounds Interesting?
Register your interest and be the first to be informed on upcoming classes!
About us
We believe that curiosity is at the heart of growth and development. We believe in enquiry-based learning and the power of learning through hands-on play. We are a digital playground in Singapore committed to hands-on learning experiences and enabling possibilities.
Unlock your potential with our STEM coding and robotics courses. Design and build your own devices through our micro:bit, Arduino, Raspberry Pi and M5Stack courses. Shop for parts at our store and further refine your skills by integrating advanced sensors, modules, IoT and even AI.